Explanations and dashboards
HUGIML explanations are close to the fitted model. Pattern labels, supports, utilities, information-gain values, coefficients, and active-pattern indicators are exposed directly from the estimator.
Pattern tables
pattern_info = clf.get_pattern_info()
importances = clf.feature_importances()

print(pattern_info.head(20))
print(importances.head(20))
Hybrid feature interpretation
For models that include original features or augmented-pair features in the downstream estimator, feature_importances() reports the fitted downstream feature space and includes a feature_type column. Augmented-pair rows include raw formula, standardized formula, observed-row coverage, and raw-scale effect fields.
print(clf.get_downstream_features())
print(clf.get_model_composition())
print(clf.explain_augmented_pair_effects())
model_summary() labels mixed models as downstream-feature summaries rather than pattern-only summaries. Pattern-only inspection remains available through get_hug_features() and get_pattern_info().
RPTE explanations
When the fitted downstream estimator is RPTE-based (see Fast hyperparameter tuning), use the flat-tree API for readable review and the table API for structured analysis:
print(clf.rpte_rule_tree())
rules = clf.rpte_rule_table()

# On the fitted RPTE estimator directly:
print(rpte.unified_rule_tree())
The flat-tree view merges shared path prefixes and shows each terminal leaf’s final LR coefficient, odds multiplier, support, centered contribution, and raw-source provenance. Direct source terms are grouped by original features, HUG patterns, and augmented pairs. condition_space="downstream" displays standardized downstream thresholds, while condition_space="both" displays both forms.
rpte_rule_table() remains the structured source of record. RPTE’s final L1 logistic model uses accepted tree-leaf indicators plus direct source terms. Rows with backend="direct_hugiml_feature" identify direct terms; tree rows retain backend="sequential_default" or backend="bounded_lookahead". The Governance Studio uses the same flat-tree formatter. shap_values_from_pattern_matrix() remains available for RPTE-based models and uses a model-agnostic explainer when required.
Interpretability metrics
from hugiml.metrics import compute_all_metrics

metrics = compute_all_metrics(clf, X_test)
print(metrics)
Common metrics include pattern count, average pattern length, coverage, mean active patterns per prediction, overlap rate, explanation sparsity, and top-k cumulative contribution.
Plotly dashboard
The dashboard requires the plots extra.
pip install "hugiml-core[plots]"
from hugiml.plots import HUGPlotter

plotter = HUGPlotter(clf)
plotter.plot_dashboard(
    X_test,
    dataset_name="Credit risk model",
    feature_names_for_profile=["age", "income", "duration"],
    output_path="hugiml_dashboard.html",
)
Existing example dashboard panels:
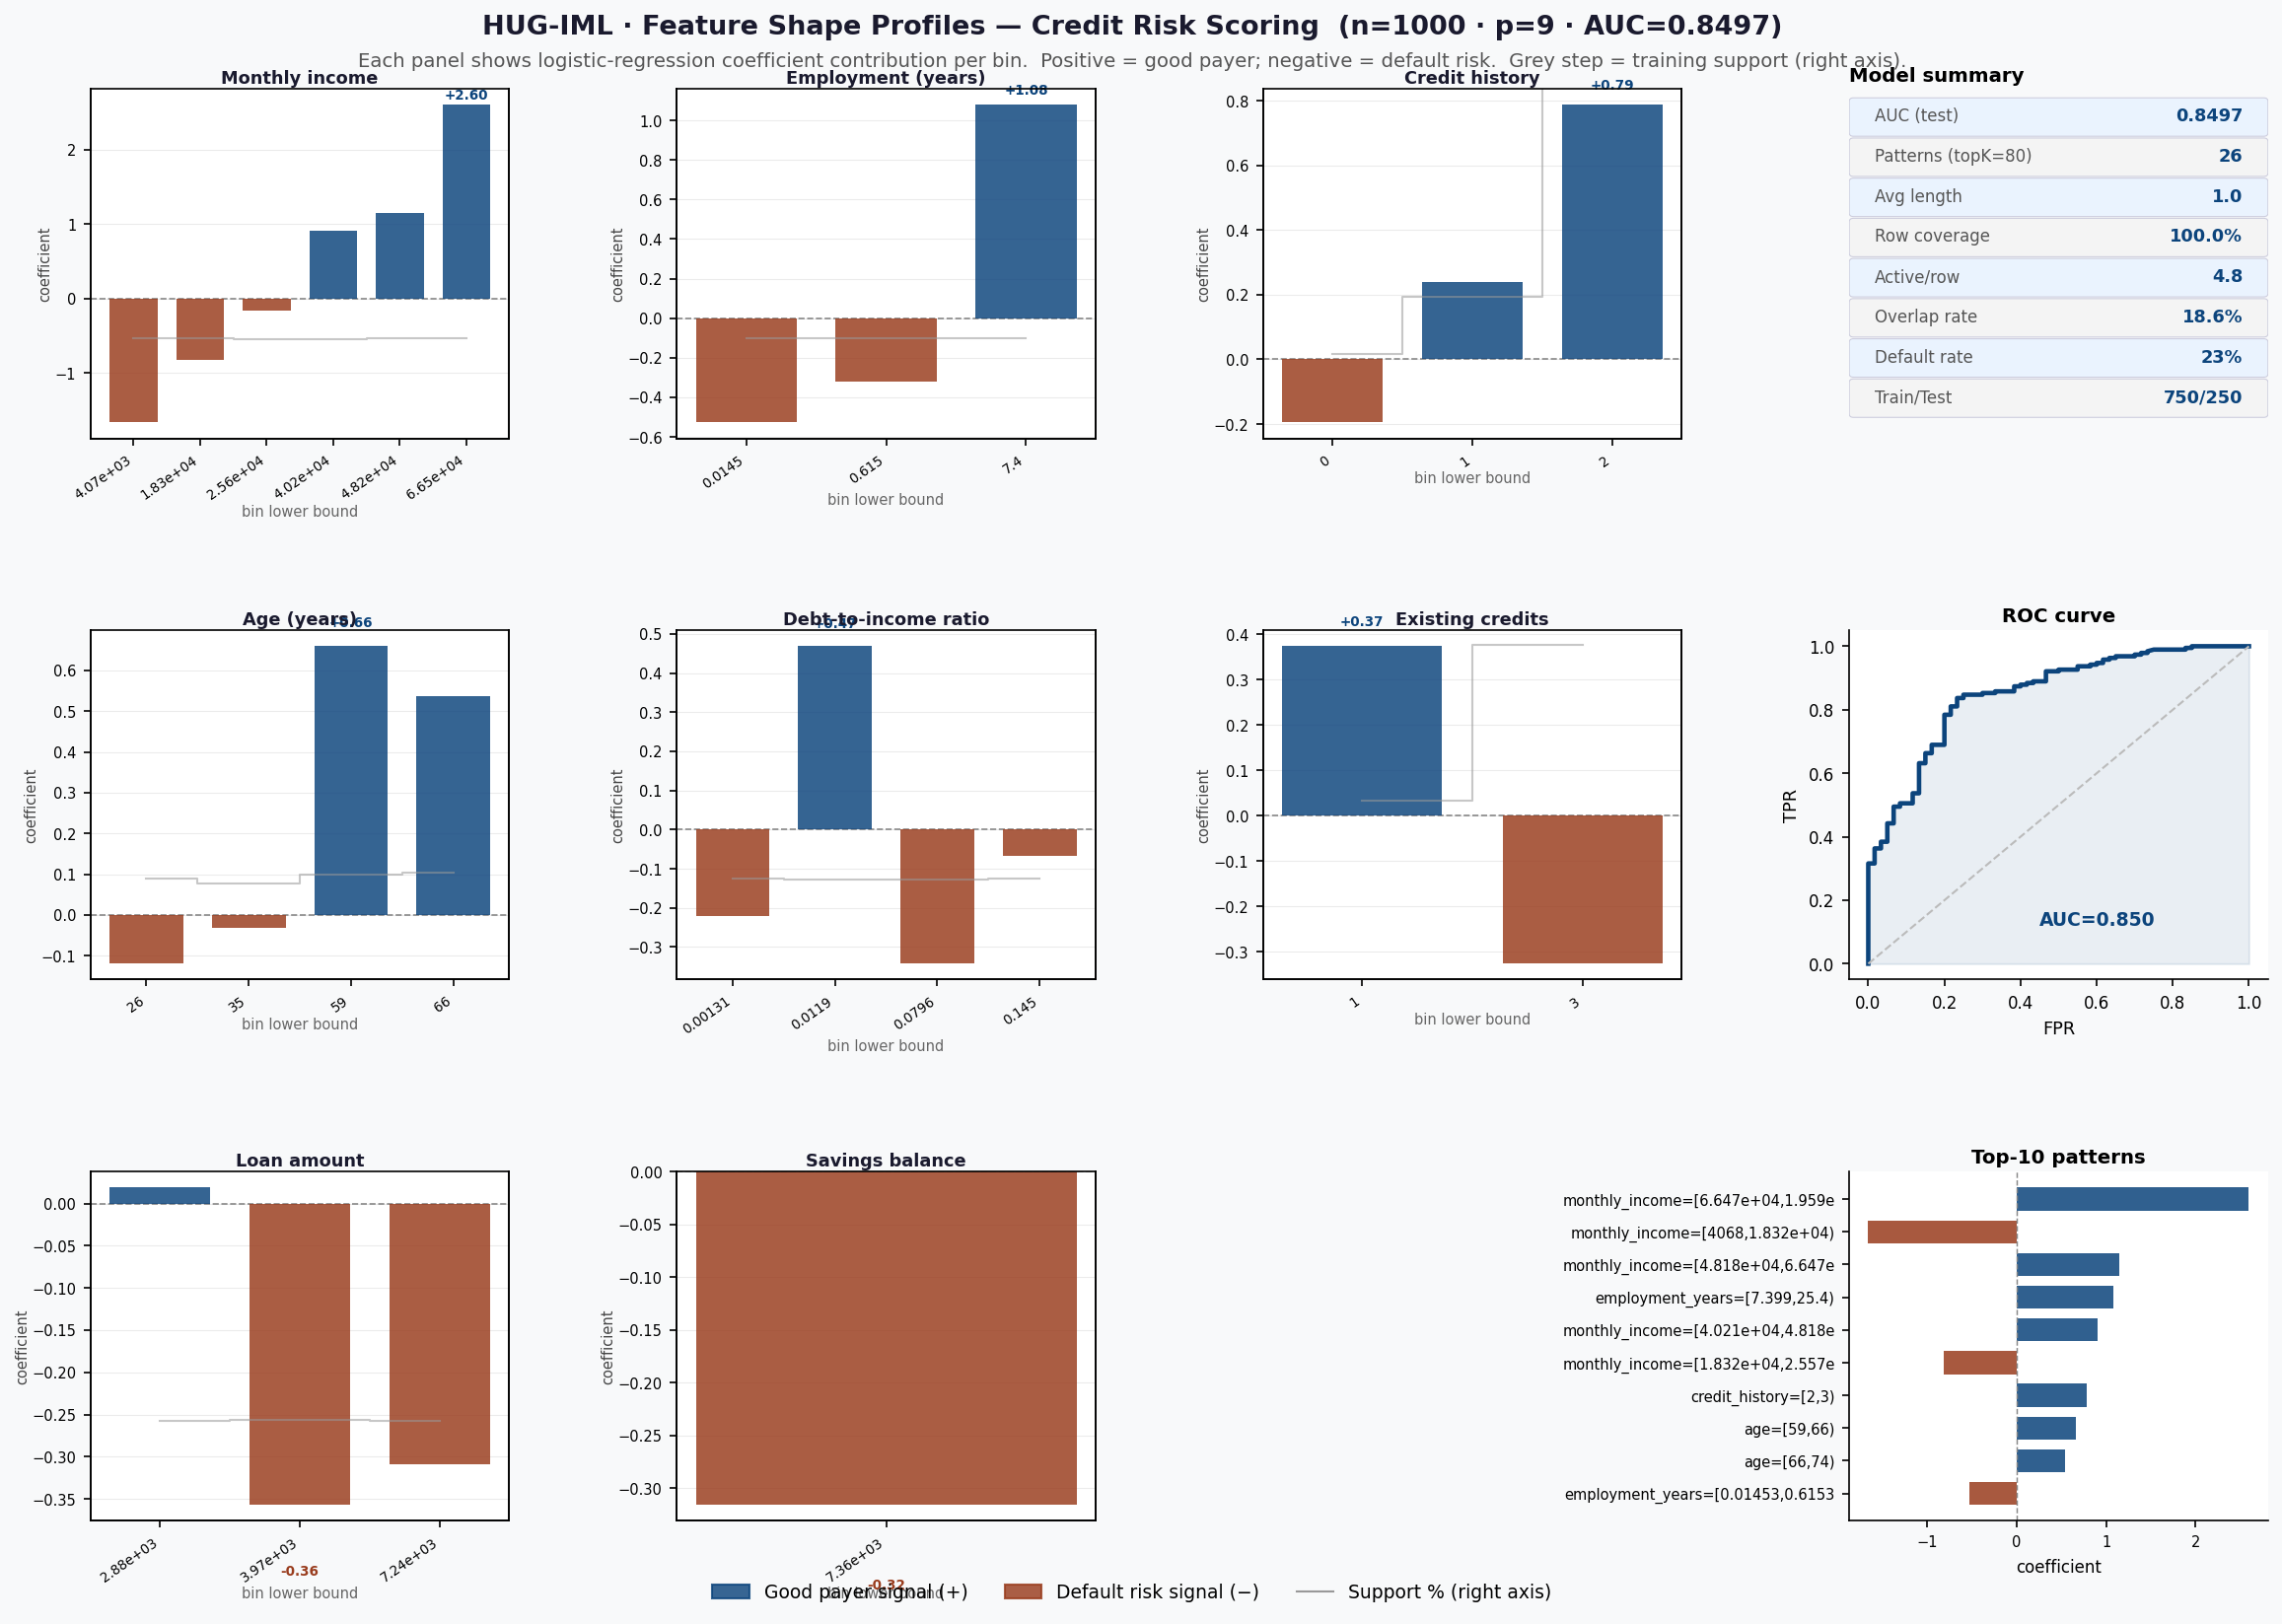
Profile views
plotter.plot_marginal_bin_profile("age", X=X_test).show()
plotter.plot_feature_combinations("age").show()
plotter.plot_top_patterns(top_n=20).show()
plotter.plot_active_patterns(X_test, sample_idx=0).show()
plotter.plot_2d_profile("age", "income", X=X_test).show()
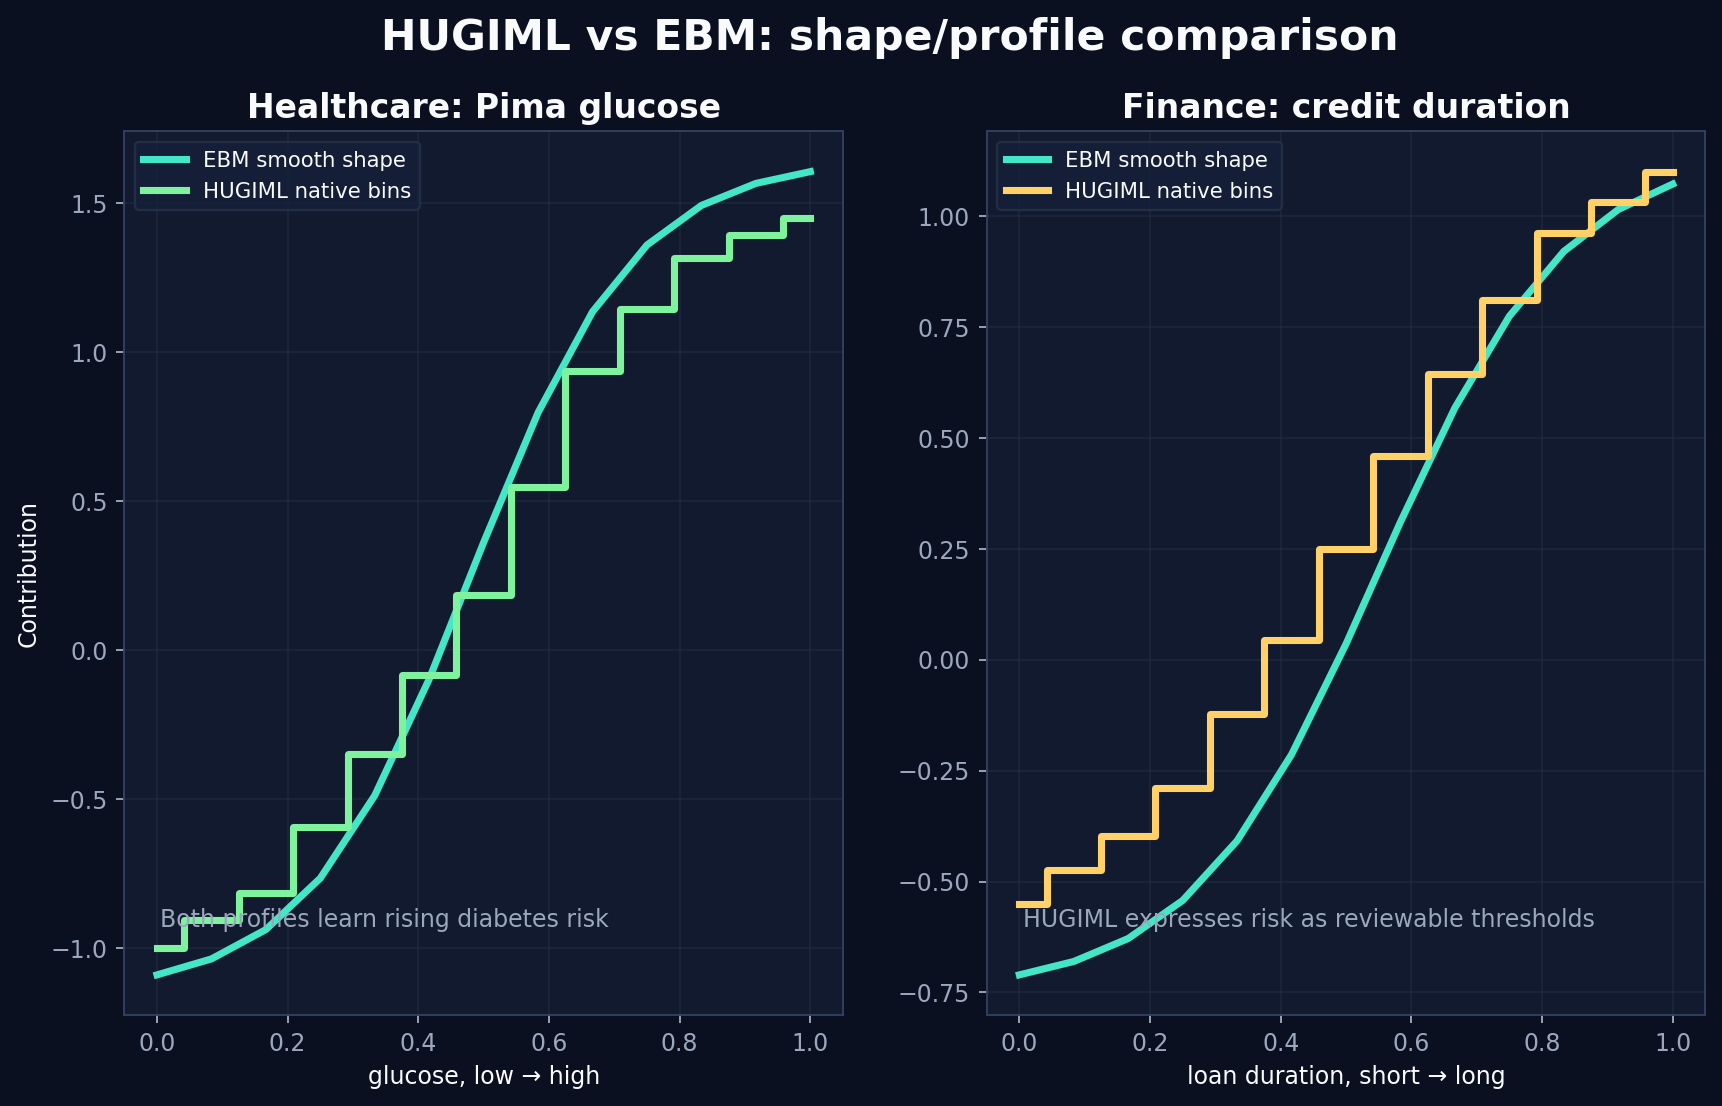
HUGIML versus additive shape models
EBM-style models learn smooth additive shape functions. HUGIML learns bin/category and compound-pattern profiles. Both can reveal directional behavior, but HUGIML expresses that behavior as compact intervals and categories that can be reviewed in audit packets.
SHAP bridge
The optional explainability module can compute SHAP values over the HUG pattern matrix and aggregate them back to original features. This is a pattern-space diagnostic. When the fitted downstream estimator also uses original or augmented-pair features, the SHAP helper reports that the pattern-space result is incomplete unless incomplete reporting is explicitly allowed.
from hugiml.explainability import (
    HUGPatternExplainer,
    shap_values_from_pattern_matrix,
    aggregate_shap_to_features,
)

explainer = HUGPatternExplainer(clf)
report = explainer.generate_report(model_id="credit-scorer-v1")
report.save("explainability_report.json")